


3 interesting Sensex Charts
With over 30 years of Sensex data, I’ve put together three charts to explore what the Sensex can tell us about investing in the Indian market. Without any further ado, lets get to it.
1. The Promise and perils of the timing the market

When analyzing historical data for the Sensex (from January 2, 1986, to January 11, 2025), one striking insight emerges: the potential outcomes of missing just a few critical trading days.
Missed Opportunities: If you missed the five best trading days during this 39-year period, the Sensex would be at 39,239 instead of its actual value close to ~77,000.
Avoiding Losses: On the other hand, avoiding the five worst trading days would lead to an incredible Sensex value of 143,041.
Given the near impossibility of predicting when these days might occur, it might make sense to stay the course instead of trying to time the market. (At least that seems to be the safer strategy)
2. Rolling return analysis

The range of returns over a 1-year rolling period is significantly higher when compared to the 3-year and 5-year rolling periods. This is evident from the Interquartile Range (IQR), which measures the spread between the first quartile (25th percentile) and the third quartile (75th percentile). Over a 1-year period, the IQR is 37%, compared to 17% for 3 years and 13% for 5 years.
What this means is that shorter investment horizons (such as 1 year) tend to experience higher levels of uncertainty and unpredictability, with a greater likelihood of extreme positive or negative returns. In comparison, longer investment horizons (like 3 years and 5 years) tend to smooth out the volatility and provide more stable returns, as the effects of short-term market fluctuations are minimized.
3. Annual volatility over time
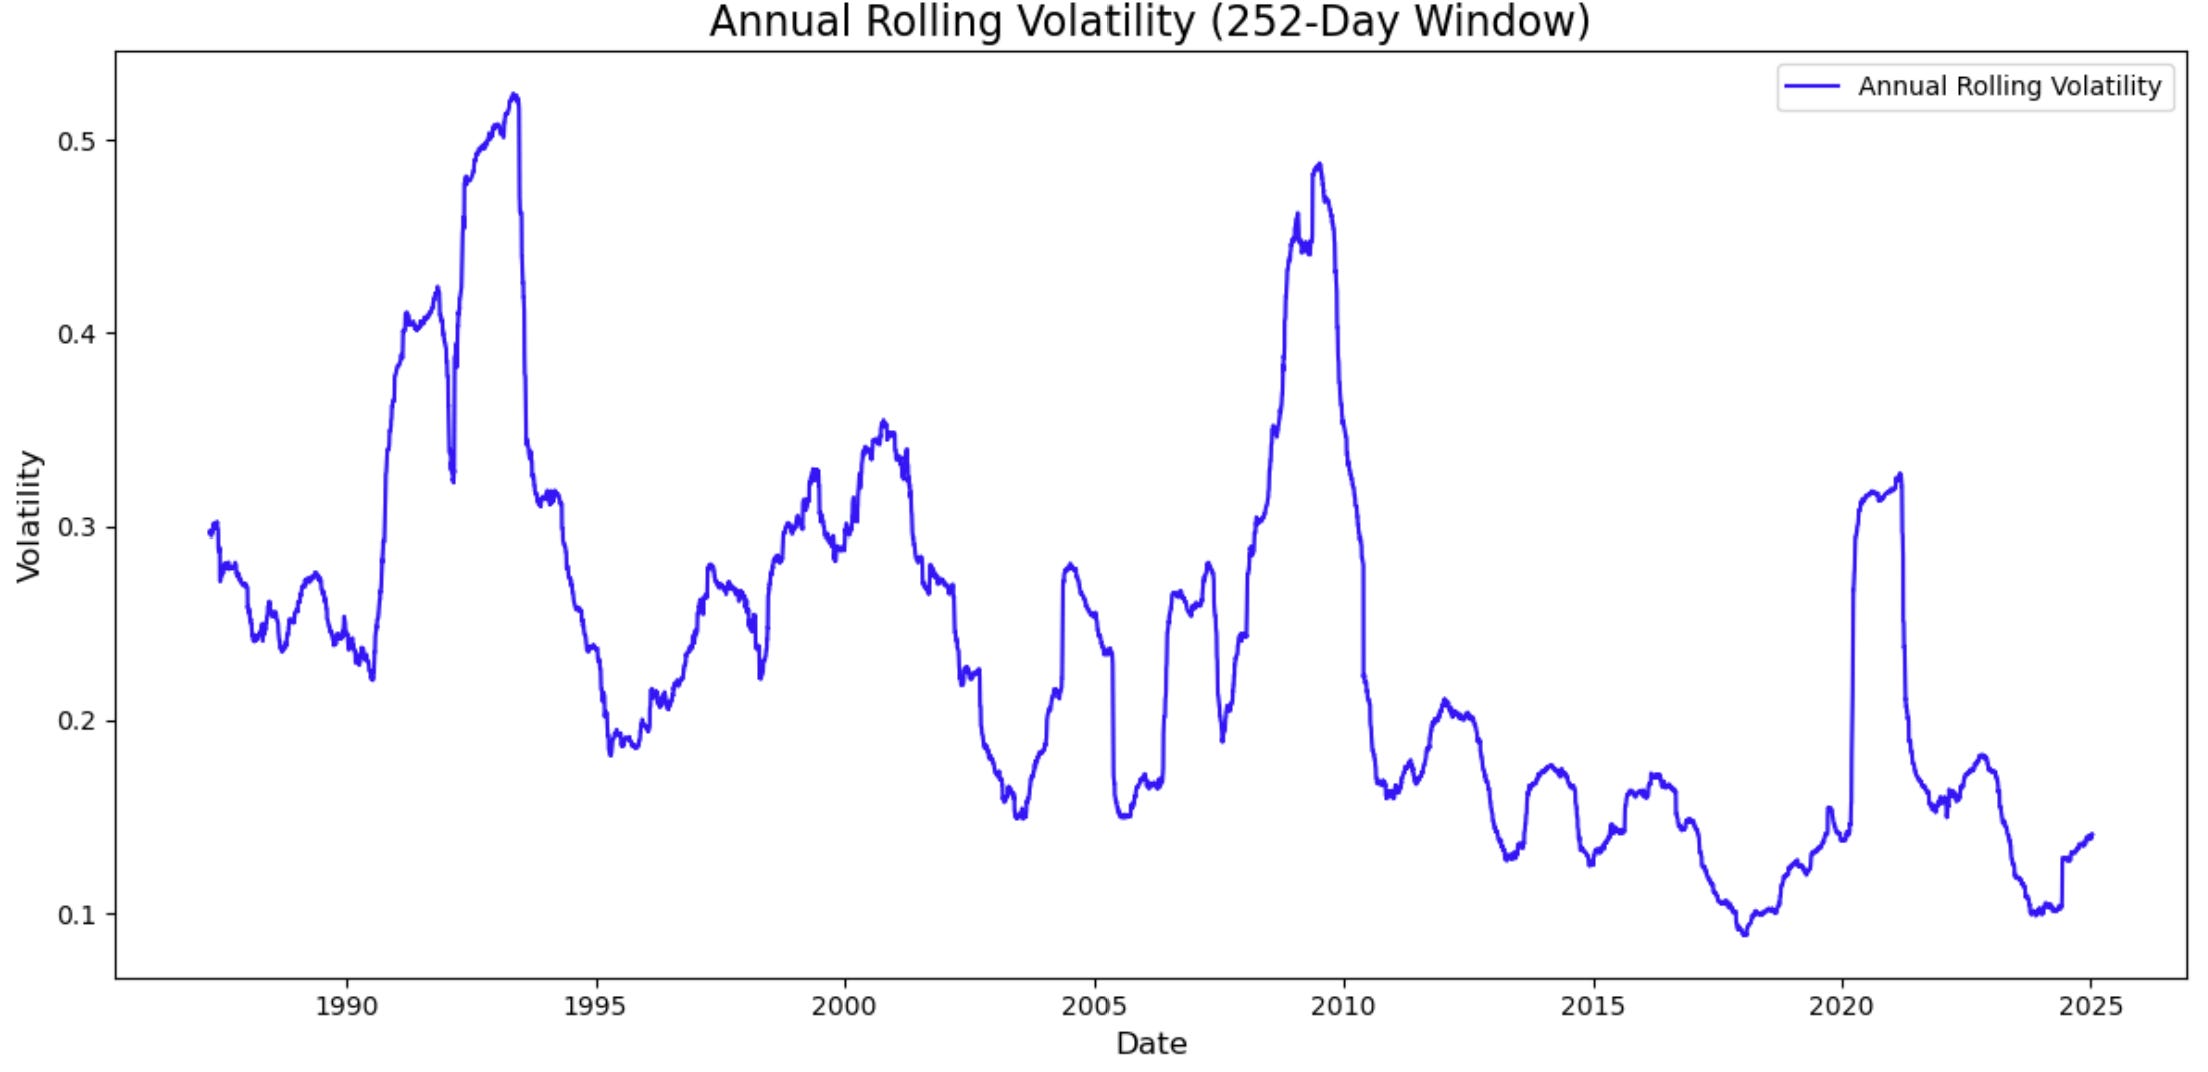
It might seem surprising, given the whirlwind of events over the last five years, but the past 15 years have actually been relatively calm when we examine the annual volatility of the Sensex. What’s perhaps more concerning is that many investors in the Indian market started investing only in the last five years. As a result, they haven’t personally experienced the higher levels of volatility seen during the 1990s and 2000s, which could lead to misaligned expectations about market behavior.
That’s it for now. If you made it so far, do consider subscribing.
Disclaimer: While I’ve made every effort to ensure the accuracy of this analysis, I cannot be held liable for any errors or omissions. This content is for educational purposes only and should not be considered investment advice.