
Fund Managers Dance to Different Beats
A factor based analysis of some mutual funds
Let me start by clarifying that this is not investment advice. I am not telling you where to put your money. I was simply curious about how different funds often have different investing styles so I thought I would explore some of that mathematically.
Four common factors are often mentioned when we talk about quant investing: momentum, low volatility, value, and quality. These factors have been discussed quite a bit, so much so that Nifty has created its own strategic indexes and there are ETFs based on those indexes. You can find data for these indexes on the NSE website and learn about how they are constructed.
I did something simple. I looked at some mutual funds from different investing houses and ran a regression where the dependent variable is the fund’s weekly returns and the independent variables are the market return (Nifty 500) and the excess returns of those four factors. Basically, I am checking if a specific mutual fund’s returns can be explained by the market return and the historical excess returns generated by these factors.
I sourced the data for the market and factors from the NSE website and mutual fund data from Google Finance. I analyzed a ten-year history from the start of 2015 to the start of 2025 and ran the regressions on weekly returns.
Here is the output.
Parag Parikh Flexi Cap Fund

About 73% of the fund’s returns can be explained by how the overall market and a few broad investment styles performed. In terms of factors, there is statistically significant proof that the fund seem to have a tilt toward the quality factor.
HDFC Flexi Cap Fund

About 93% of the fund’s returns can be explained by the market and certain investment styles. The fund closely follows the market. It tends to move away from momentum and quality factors but leans strongly toward the value factor.
Quant Flexi Cap fund

Interestingly, the fund shows statistically significant positive relationships with three factors: Momentum, Low Volatility, and Value. The model explains about 74% of the fund’s returns.
SBI Focused Equity fund

The model explains about 81% of the fund’s returns, showing a strong connection with the overall market. Among the factors, quality has a positive impact on returns, while low volatility has a negative effect.
ICICI Prudential Focused Equity Fund

This model explains about 86% of the fund’s returns. The fund moves closely with the overall market. Among the factors, value and low volatility positively impact returns, while momentum has a slight negative effect.
Kotak Flexi cap fund

Interestingly, outside the market, not one factor showed any statistical significance.
Motilal Oswal Flexicap Fund
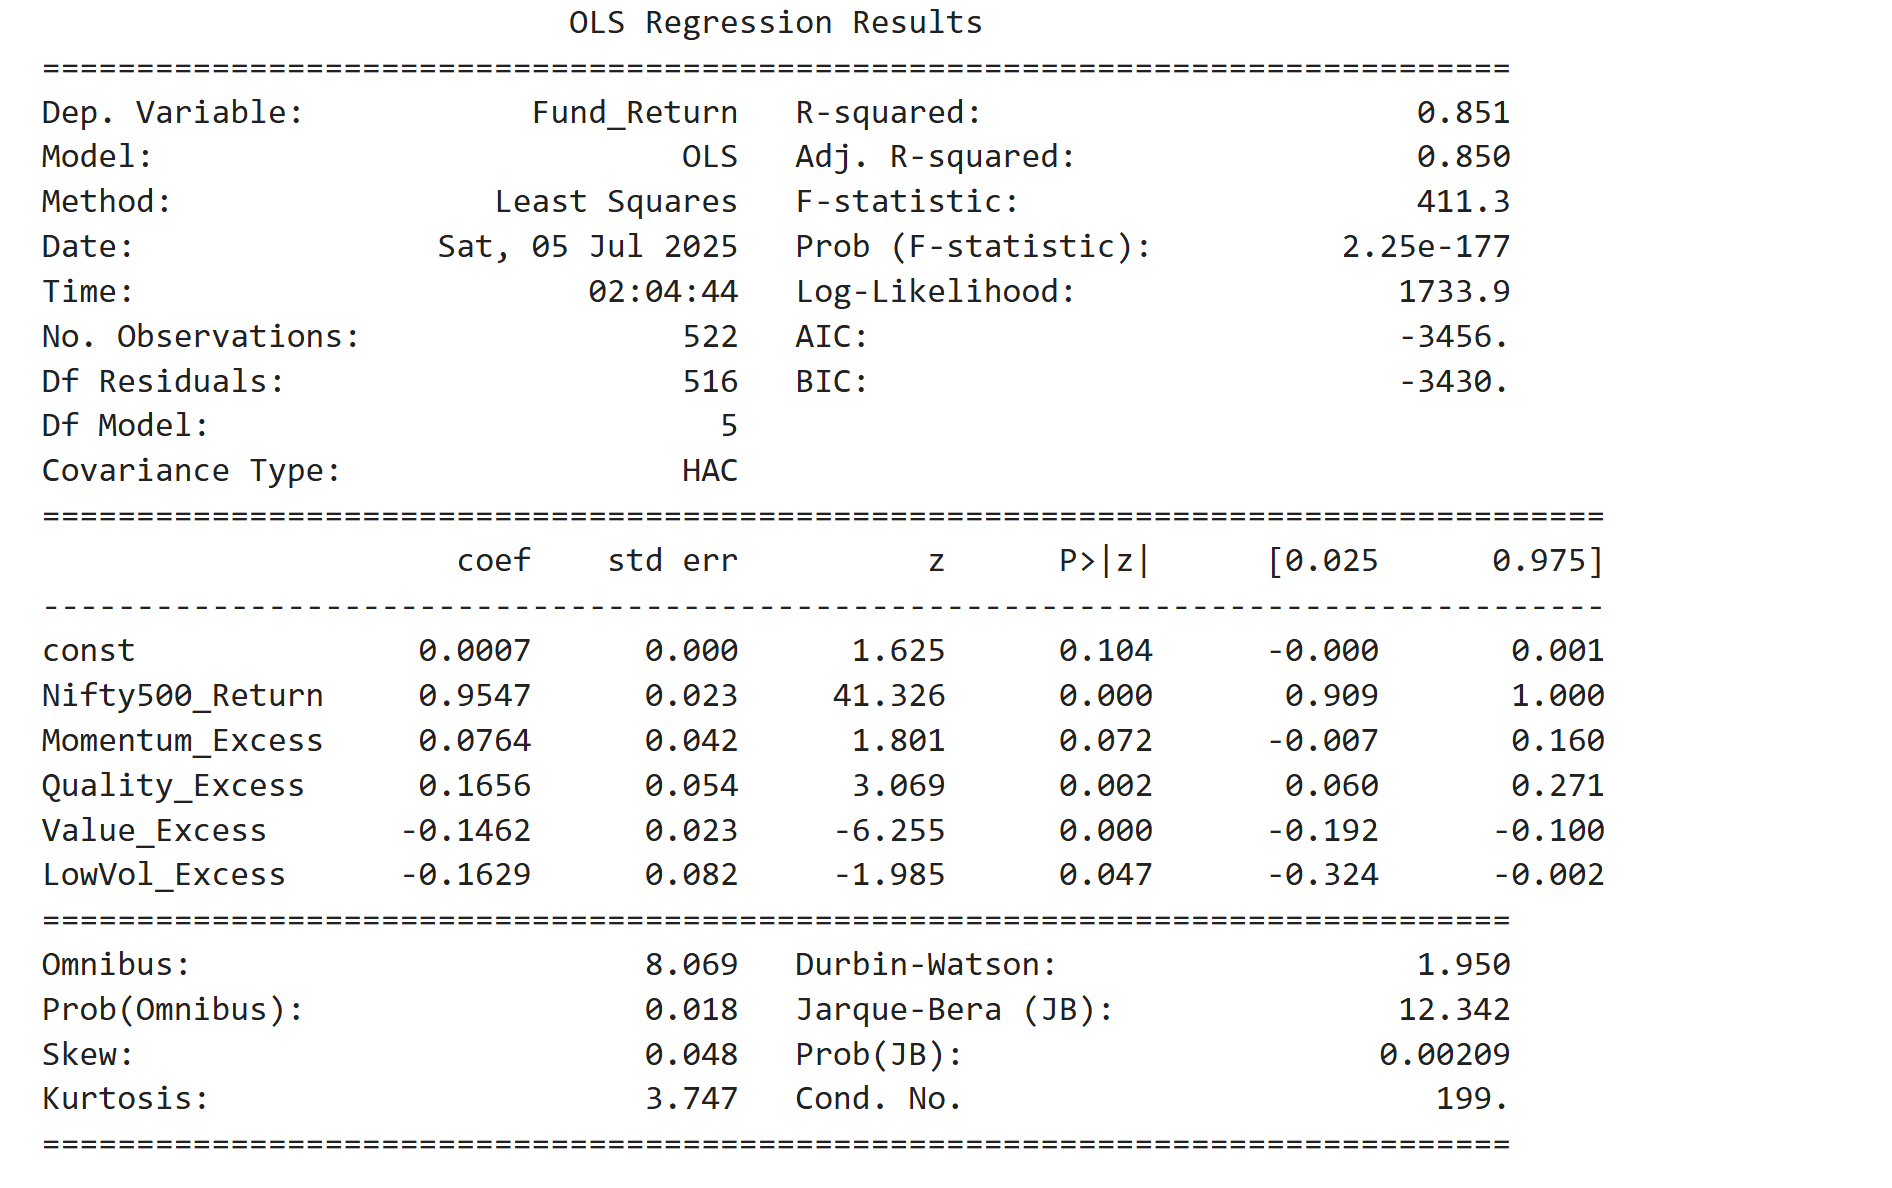
About 85% of its returns are explained by the model. The fund seems to benefit from the Quality factor, showing a positive relationship there. Interestingly, it shows a negative relationship with Value and Low Volatility factors.
360 One Focused Equity fund
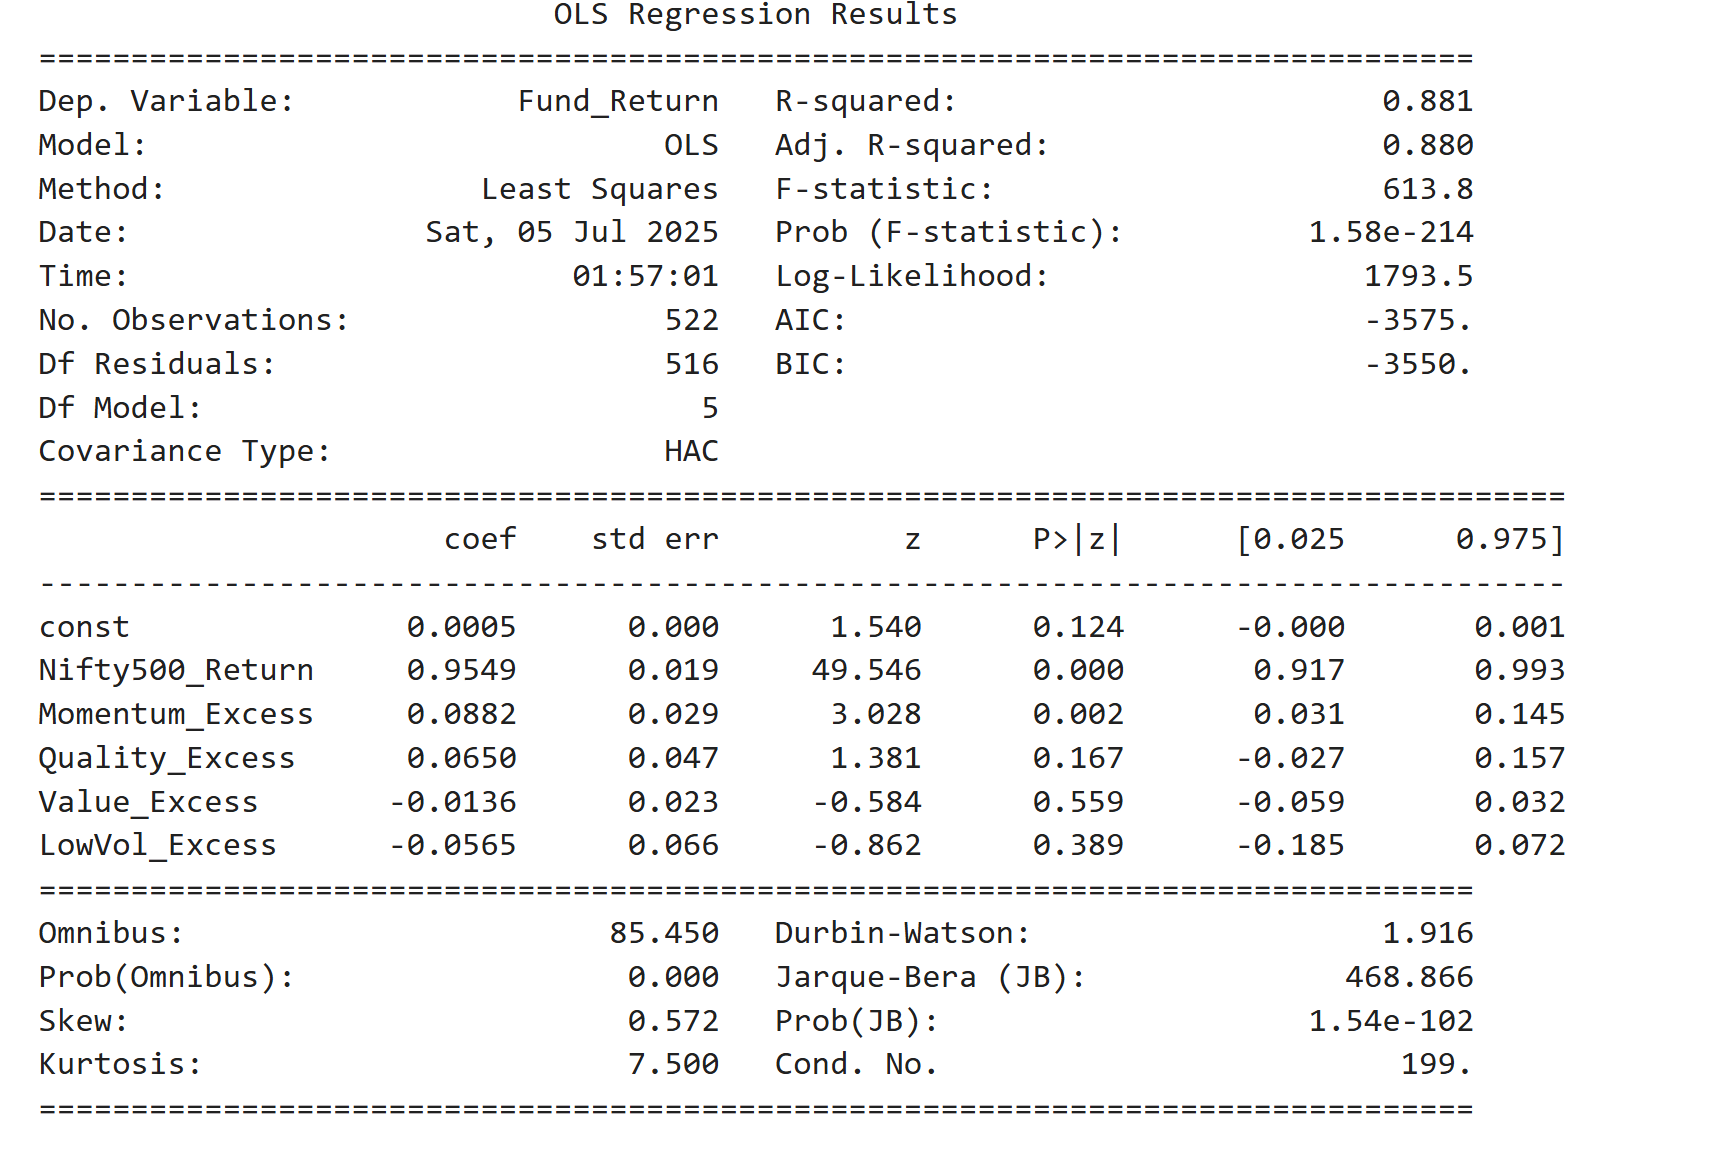
About 88% of the fund’s returns are explained by the model. The fund has a strong positive link to the market returns. It also shows a statistically significant positive connection to the momentum factor.
I could continue doing this analysis for more funds, but some things are already quite evident. Firstly, as you would expect, all funds seem to have a strong reliance on the market return, which in this case was the Nifty 500. So, if the market does poorly, don’t expect these funds to miraculously deliver good returns. That might be obvious, but it is good to see it confirmed mathematically.
Secondly, and more importantly, some funds do have distinct styles. The fact that some funds show significance to only one factor clearly supports this. The fact that these funds have performed well suggests there isn’t just one sure-shot way to make money in the market. This also highlights an important idea to keep in mind when thinking about diversification.
One big caveat I would add is that fund styles may change over time, and unfortunately my analysis does not necessarily capture those shifts.
That’s all for now.
Disclaimer:
The information provided here is for educational and informational purposes only and does not constitute investment advice or a recommendation to buy or sell any financial instruments. While efforts have been made to ensure accuracy, no guarantees are made regarding the completeness or reliability of the information. Readers should conduct their own due diligence and consult with a qualified financial advisor before making any investment decisions.