
So I Dug Into Every Ball Ever Bowled in the IPL
A deep dive into the numbers
You’ve heard the debates before. Scoring is up, bowlers are suffering, and every new season is apparently the most aggressive one yet. At some point, it all just starts to sound like background noise.
So instead of adding another opinion to the pile, I found myself doing the slightly obsessive thing. I went back to the beginning, pulled ball-by-ball data for every delivery ever bowled in the IPL, and tried to see what the numbers actually had to say. Strip away the takes, the recency bias, the dramatic sighs about the death of bowling, and just look at what’s happening.
A few things stood out almost immediately.
1. Scoring rates have indeed gone up.
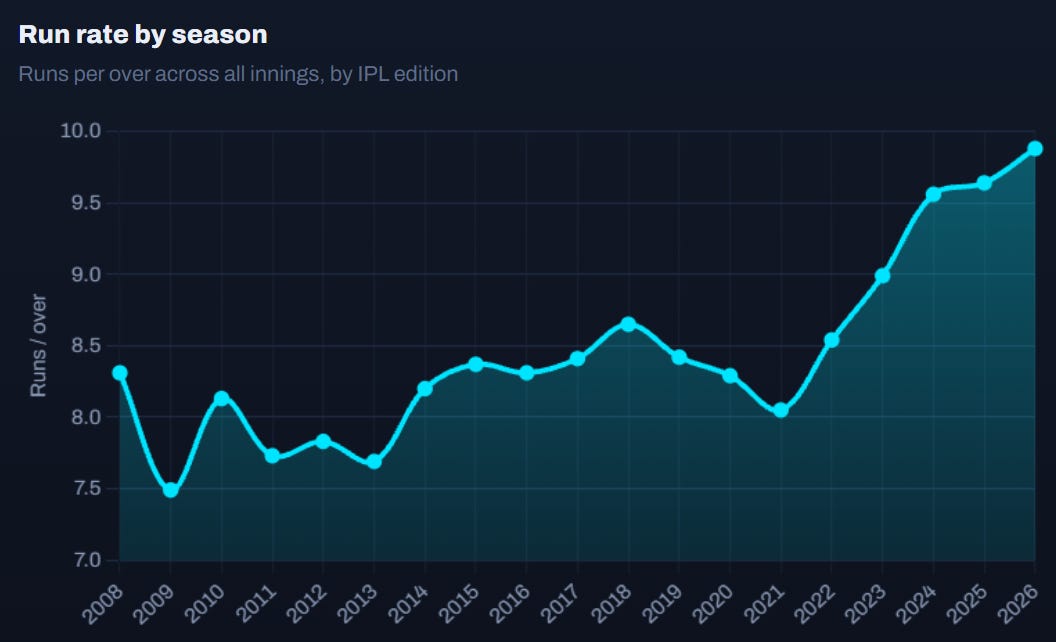
The run rate has climbed from 8.31 an over in 2008 to 9.88 in 2026. A run and a half extra each over. Over a full innings, that is the difference between a par score and a chase nobody quite fancies.
The Impact Sub deserves some of the blame. An extra batter brings an extra licence to swing.
The trend is upward, but not neat. There have been dips along the way, with run rates falling below 2008 levels in 2009, 2011, 2012, 2013, 2014, 2020 and again in 2021.
2. How do batsmen get out the most?
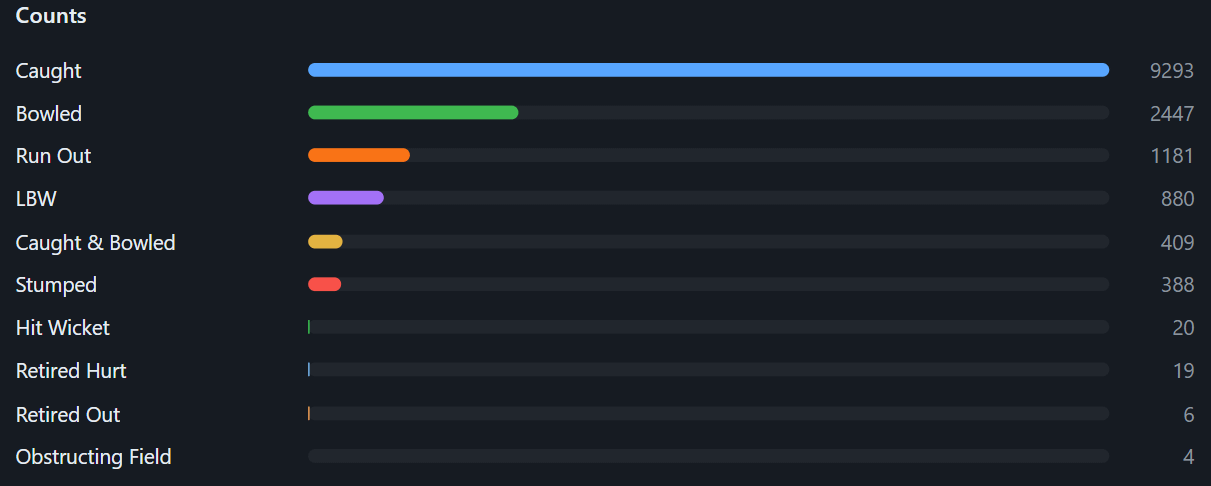
Ten ways to lose your wicket, and in practice only two of them seem to matter. Caught alone accounts for 9,293 dismissals, nearly four times the next category. Add bowled and you have three in every four IPL innings accounted for.
Everything else is detail. Run outs and LBWs turn up often enough to matter, stumpings and caught-and-bowleds are the occasional garnish, and beyond that you reach the endangered end of the list. Twenty hit wickets in eighteen seasons, six retired out, four for obstructing the field.
Sai Sudharsan, in 2026, seemed briefly intent on keeping hit wicket alive all by himself.
3. When do batsmen usually get out?
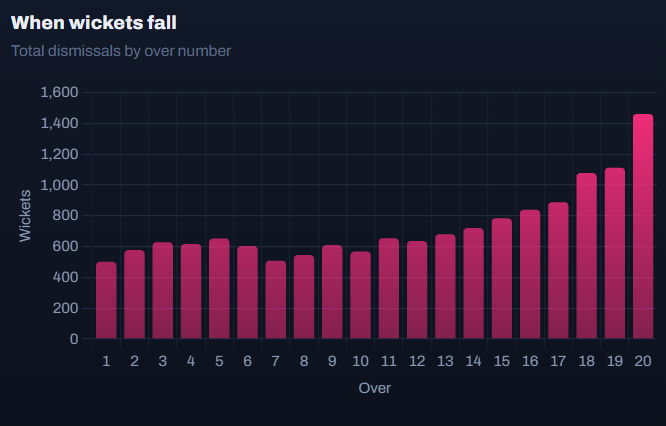
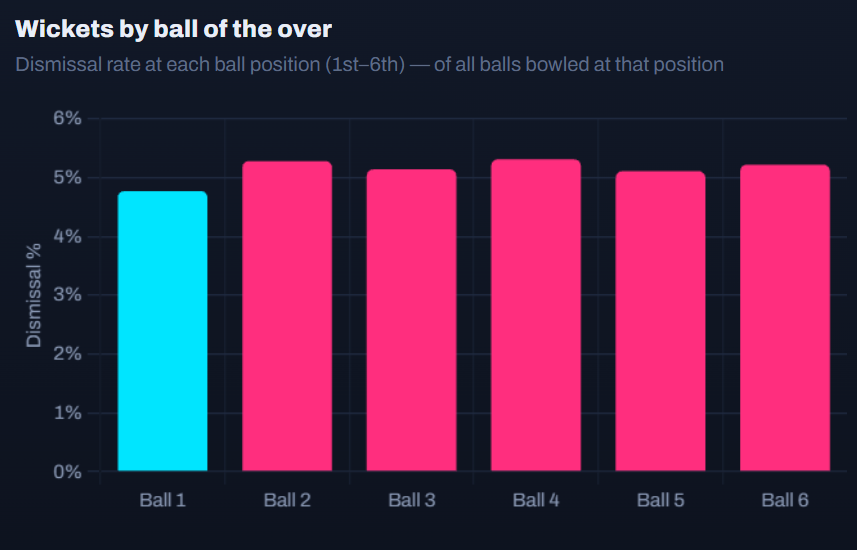
Two charts, same question, different zoom. Across the innings, there’s a clear shape. Wickets tick along, then surge at the death. The last over alone accounts for about 1,450 dismissals, far more than any other. By then, everyone is taking risks. Within an over, that shape disappears. Ball two to six are almost identical, each just over a five percent dismissal rate. Only the first ball is slightly safer.
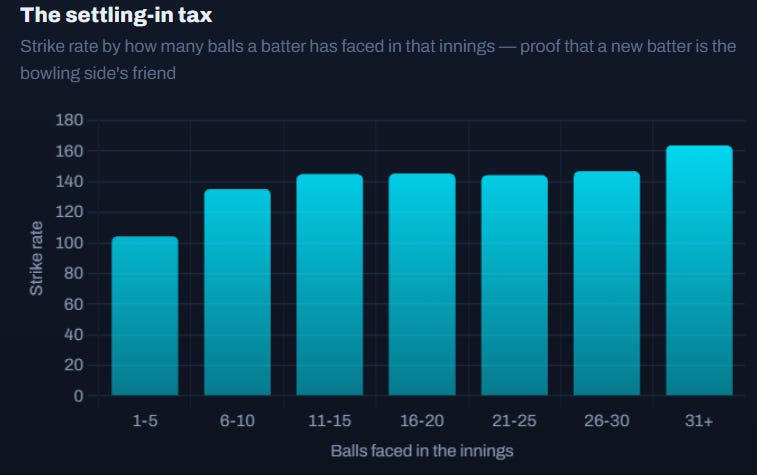
The settling in tax

On average, a batter strikes at just 104.43 in his first five balls, climbing past 163.82 once set. Every new batter resets the clock, which is probably why a wicket is often worth far more than one dismissal.
5. Average, Mean and Median..
A batting average divides runs not by innings but by the number of times you got out, so every not-out quietly inflates it. The mean is the honest version, runs over every innings played. The median is the typical innings, the score in the middle, immune to one freak 150 dragging it up. We look at all three for players with more than 30 innings in the IPL.
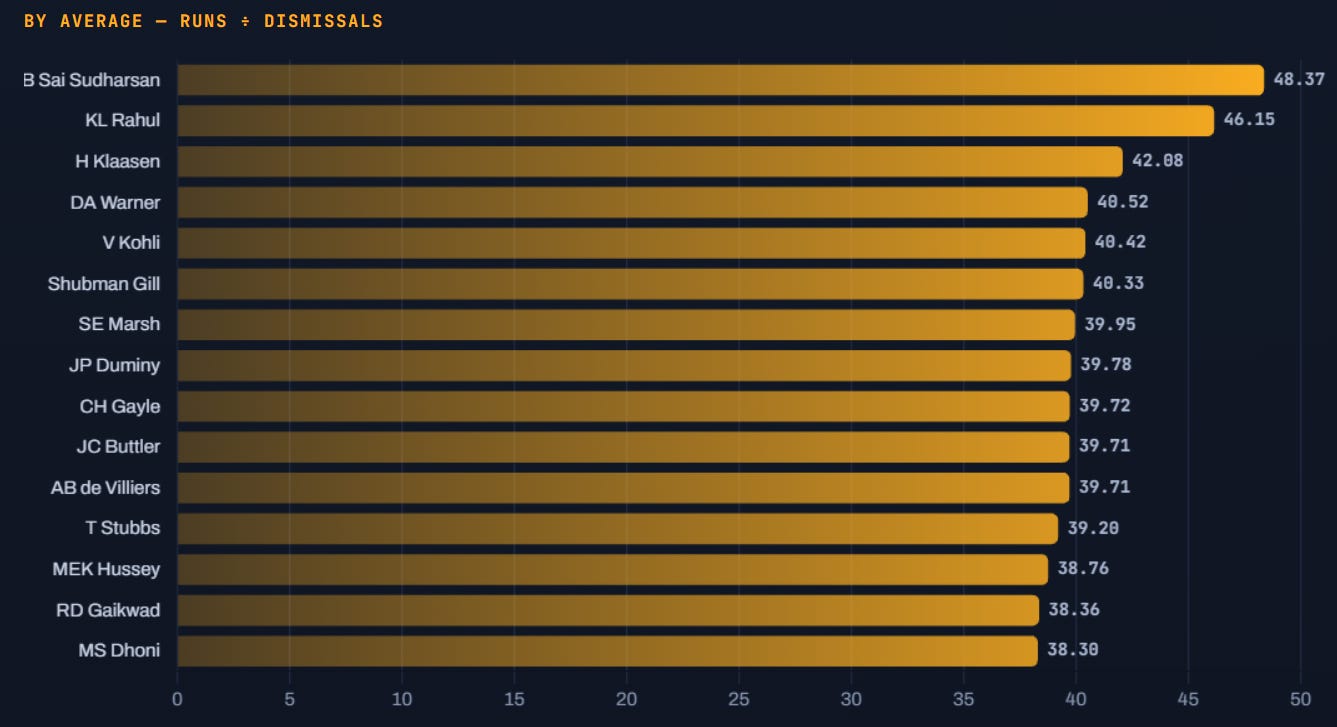
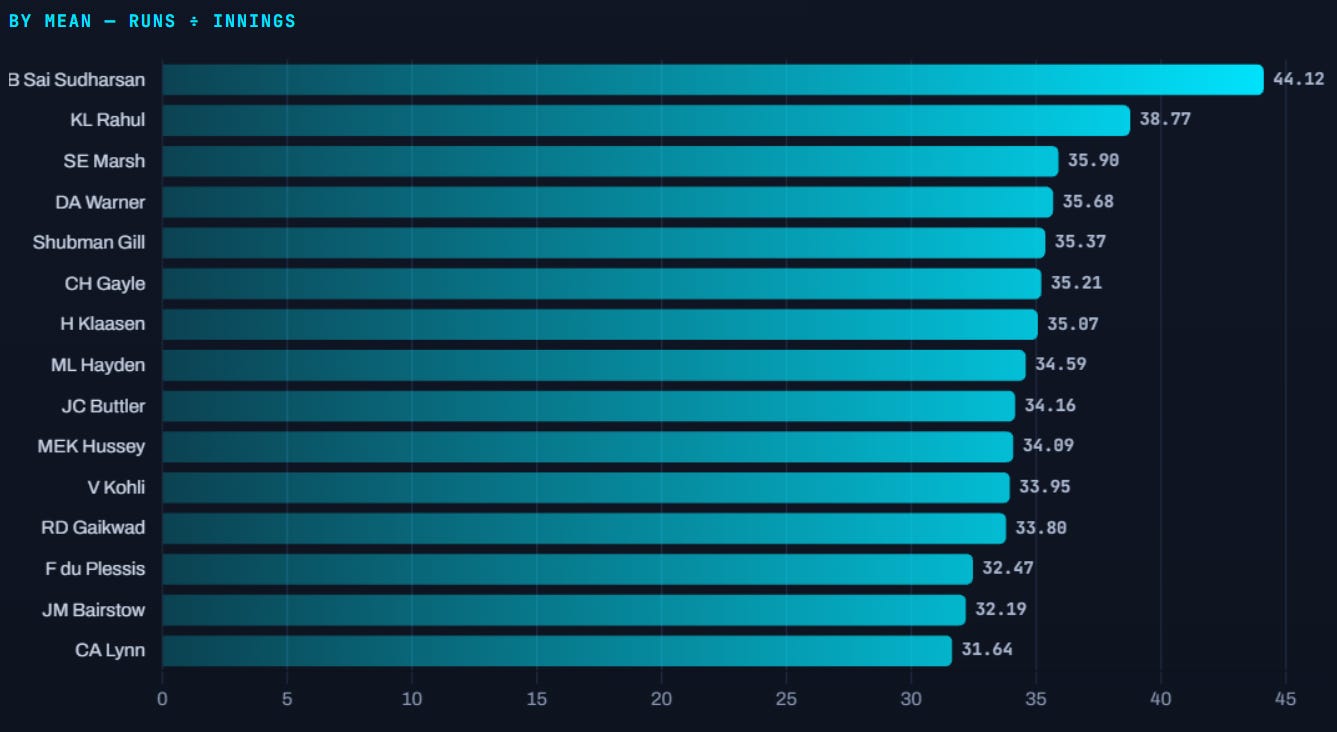
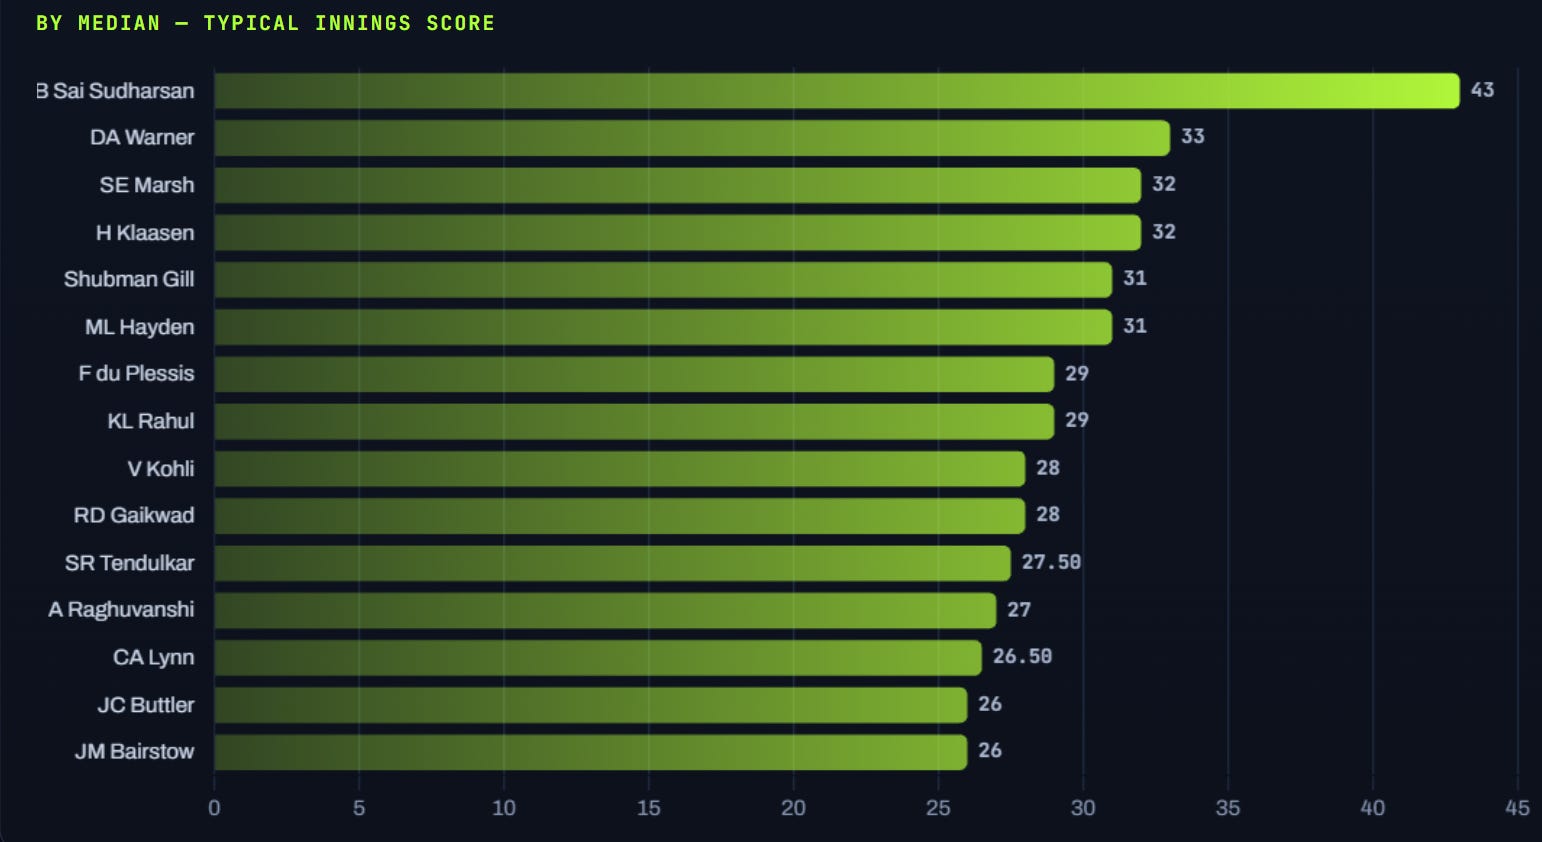
Sai Sudharsan leads all three lists, and not by a small margin. His median of 43 sits a full ten runs clear of the field, and his mean and average are out on their own too. The caveat is that he’s a recent arrival, working with a smaller and more flattering slice of seasons than the Kohlis and Warners he’s leapfrogged, and numbers this far ahead usually drift back. But the consistency is real for now.
The better story is who moves when you change the lens. MS Dhoni is the cleanest example. He’s good enough for the top fifteen by average at 38.30, then simply vanishes once you divide by innings instead of dismissals. That’s the not-out tax made visible: a finisher who walks off unbeaten gets rewarded by the average column and ignored by the mean.
Then there’s the gap between a batter’s mean and median, which is really about how the runs are spread. Sudharsan’s two figures are nearly identical, so his scoring is even. KL Rahul’s are not that even. Neither are Kohli’s. None of this makes them lesser players. It just means the average, the first figure we reach for, is also the one most willing to tell a kinder story than the other two.
6. Does the toss matter?
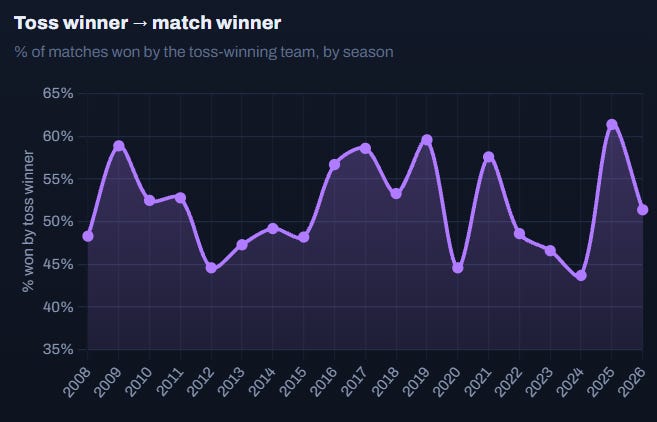
Some captains agonise over the toss; the broadcast treats it like the first wicket of the day. So here is the blunt question put to eighteen seasons of data: win the toss, and how often do you go on to win the match? About half the time. The line spends eighteen years bouncing around the 50% mark like a coin still deciding which way to land, because that is more or less what it is. Some years the edge looks real, 2009 and 2025 both cleared 60%. Other years it inverts and you’d have backed the team that lost it, with 2020 and 2024 dipping under 45%. Average it out and you’re left a rounding error away from random. The toss decides who bats first. It does not decide who wins
7. Teams love to chase
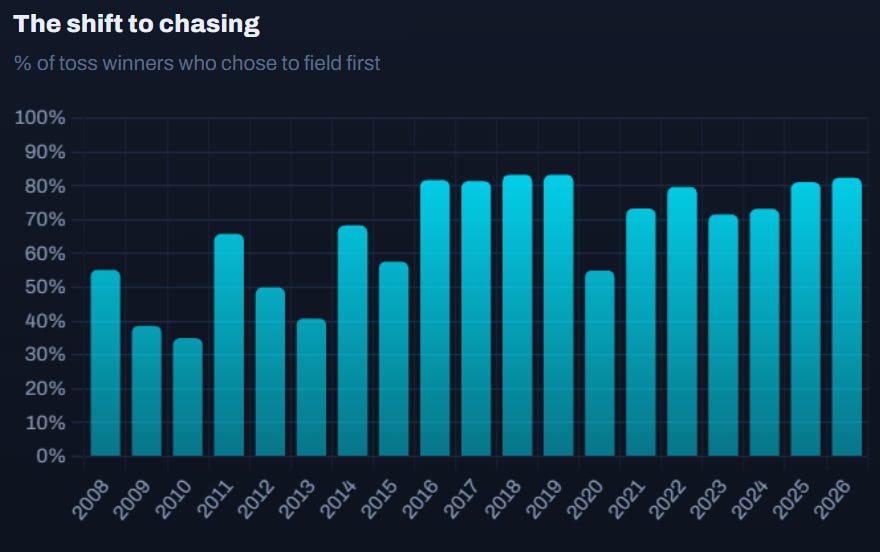
Where captains were once split, nearly 80% now choose to field first. The numbers back it up. Teams chasing win about 55% of the time, compared to roughly 45% for those batting first.
8. MOTM
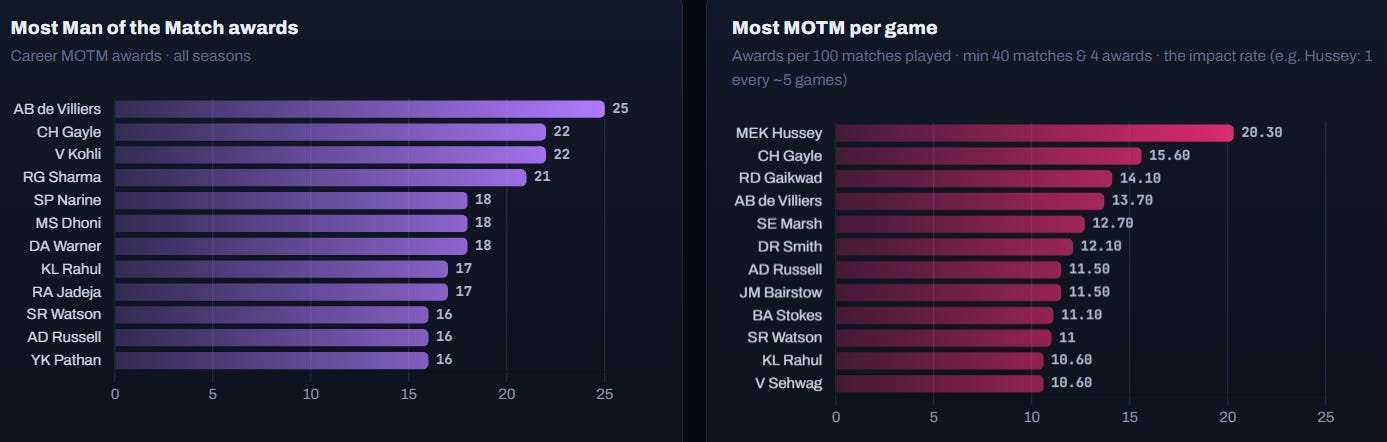
Man of the Match is the league’s own verdict on who decided the game, and there are two ways to count it. The left panel is the raw pile of awards, and it’s really a longevity list: de Villiers, Gayle, Kohli and Rohit cluster at the top because they played forever and were brilliant for most of it. The right panel strips that out, asking how often per game a player actually walked off with the trophy, and clear of the entire field stands Michael Hussey at 20.3 per hundred matches. Roughly one Man of the Match every five games he played. Gayle is next, and it isn’t close. The other thing both lists agree on is the quiet death of the bowler: top to bottom, it’s batters and all-rounders. The award has always been a little in love with the men who score the runs. And Michael Hussey, it turns out, is the most Goated of the lot.
9. xRuns: Outperforming Expectation
I wanted to actually measure, how much more are you scoring than the average batter would in the same situation?
For every season I compute the average strike rate by phases. Powerplay, middle overs and endgame. And then we calculate how many balls each batsmen played in each phase. If the league average powerplay SR in 2023 was 148, and you’re facing a ball in the powerplay in 2023 at the same ground, you’re “expected” to score 1.48 runs from that ball. The difference between what you actually score and what was expected, summed across an innings, is your xRuns for that innings.
Average it over a career and you have xRuns per innings.
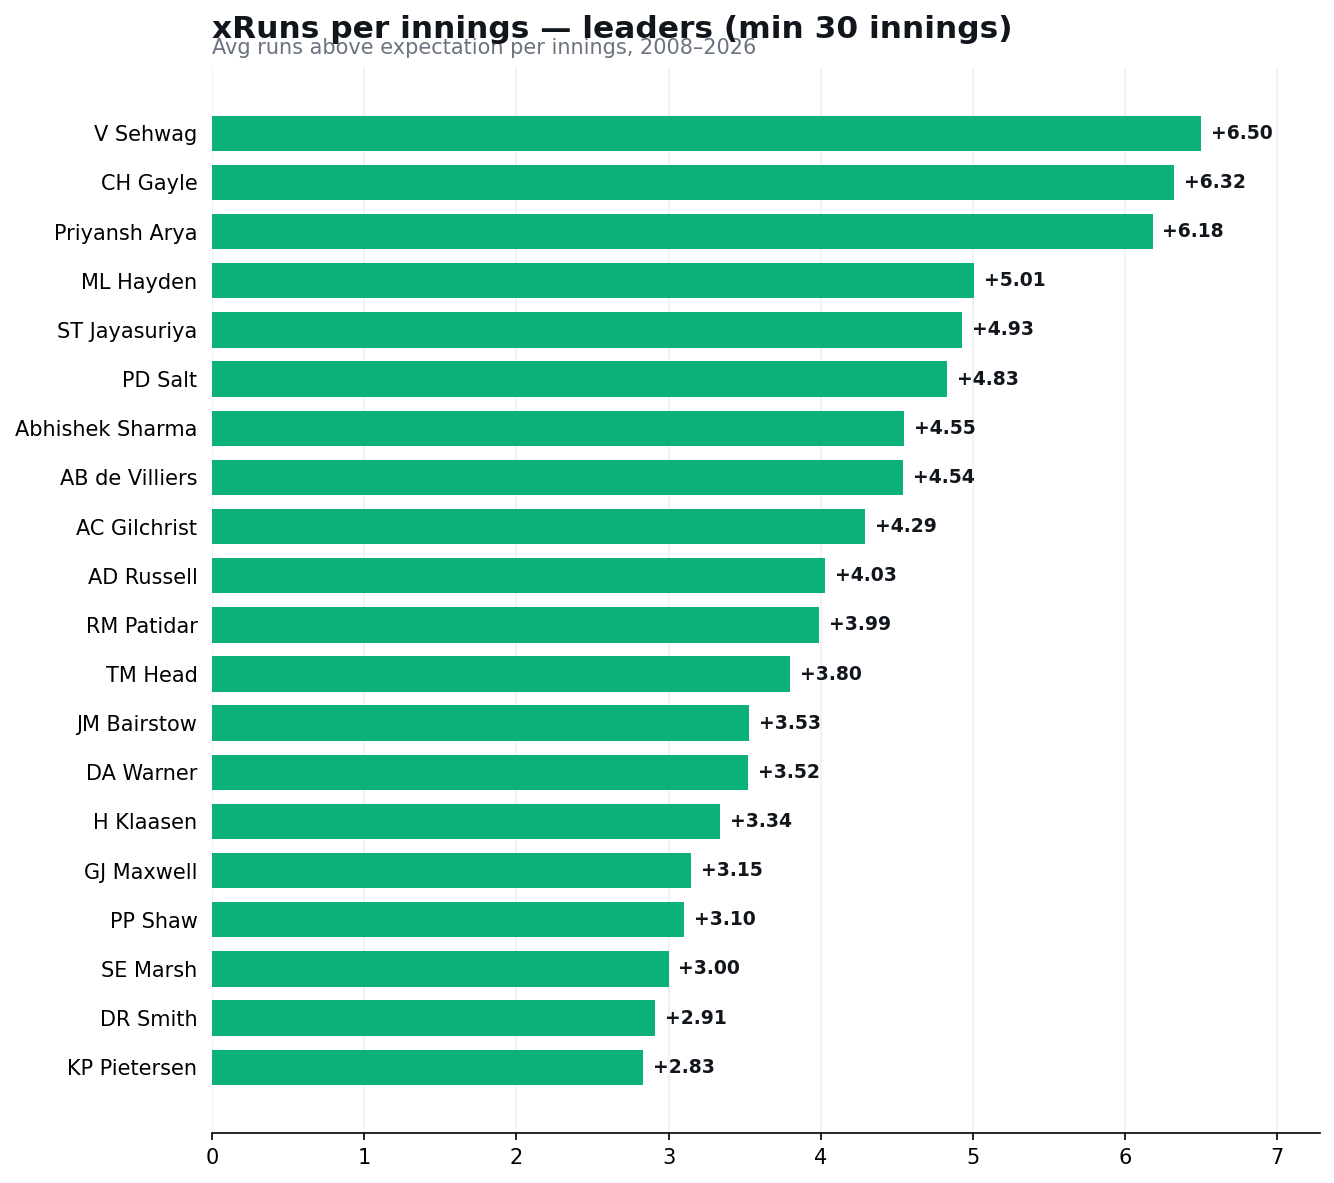
A raw strike rate buries that under the averages of the era. xRuns doesn’t. It judges every ball against its own season, so a 140 in 2009 is worth more than a 140 in 2024. Back then, it was practically heresy.
That’s why the leaderboard reads like a roll call of men who arrived before the game caught up. Sehwag. Gayle. Hayden. Jayasuriya. They didn’t ride the run scoring boom, they previewed it. What looks ordinary now was, in its moment, the future arriving early. xRuns gives them the credit the scorecard never did.
10. Reliability check
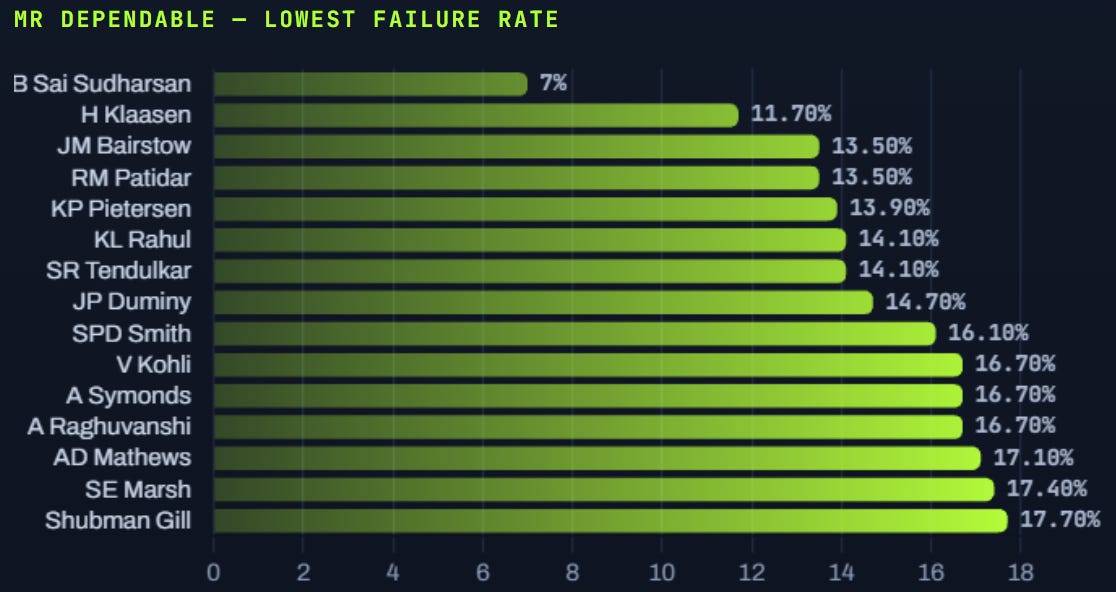
This question is less glamorous, but far more useful when you’re building a team: on your bad days, how bad are you?
Every batter has off innings. The real question is what “bad” actually looks like. I define a genuine failure, a proper dead-weight innings, as one where you score fewer than 10 runs and your strike rate falls below 75% of that season’s league average. Both conditions have to hold. Slow and low, together.
On this lens, Sudarshan stands out yet again. Klaasen strengthens his case as one of the greatest, not just because he rarely fails, but because he still shows up on the xRuns list. Kohli, meanwhile, shines here too, a function of both longevity and consistency across an enormous sample of games.
Anyway, that’s what the numbers had to say. Make of it what you will. Thanks for reading!