
What Returns Can You Really Expect From the Stock Market?
I am sure you have come across this question or maybe even asked it yourself: “If I put my money in the stock market what kind of returns can I expect?” It sounds straightforward but is anything but. The stock market rarely moves in a straight line, and that makes all the difference
Usually, I’d start talking about valuations, the Indian economy, and all the usual factors before trying to give an answer. But this time, I decided to take a step back and focus on what the past can tell us by diving into decades of historical data from the Sensex.
The goal is to get a clearer picture of the base rates — the actual returns the market has delivered over time.
Now you might be thinking, wait, we already know this. Around 13 to 15 percent, right? Well, yes. From January 1, 1986 to January 1, 2025, the compound annual growth rate, or CAGR, comes to about 13.57 percent. That is nearly forty years of data, which gives this number some real weight.
But does that mean, you should expect something similar, when you invest?
It really comes down to how long you are investing for.
Let me show you some numbers to back this up.
Let’s start by focusing on a one-year investment horizon. We’ll look at one year rolling returns. For those new to finance, rolling returns show the return you would get if you invested on any day and held your investment for a fixed period—like six months, one year, or five years.
Instead of just looking at a few fixed intervals, rolling returns calculate the return for every possible period of that length. For example, for a one-year rolling return, you look at January 1, 2001 to January 1, 2002, then January 2, 2001 to January 2, 2002, and so on. This captures how returns can vary day by day, rather than just over simple calendar years.

When we examine all possible one-year rolling returns from 1986 to 2025, the sheer range of outcomes is striking.
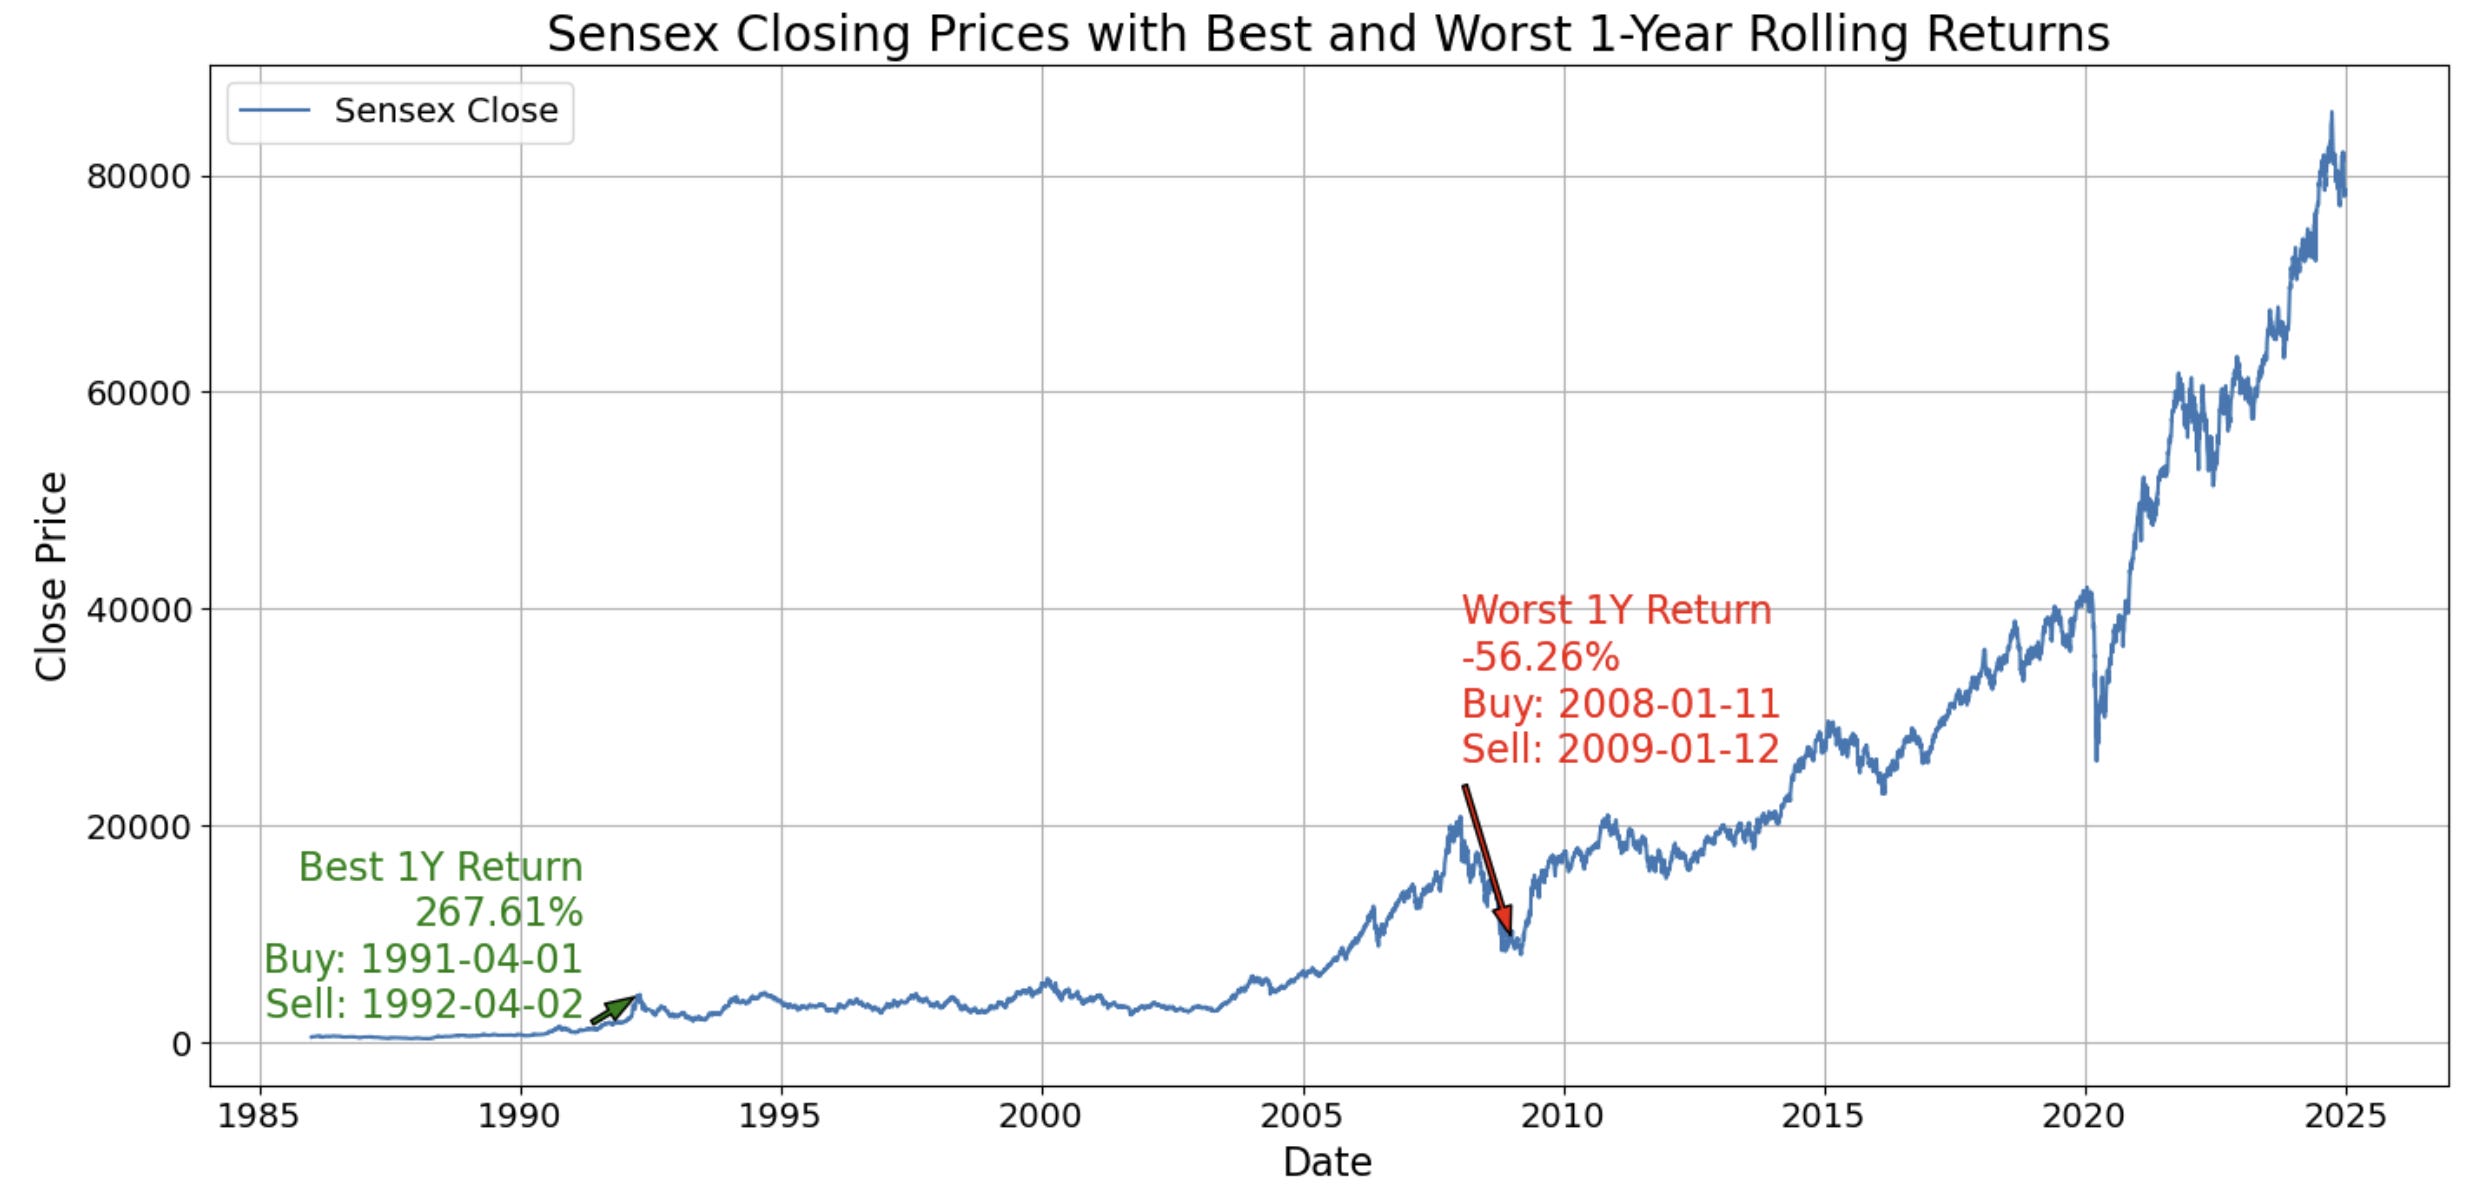
For instance, investing in the Sensex in April 1990 and selling just a year later, in April 1991, could have delivered gains of nearly 267 percent. On the flip side, investing in January 2008 might have resulted in a loss of more than 56 percent in a single year. These are, of course, extreme cases and not typical experiences, but they highlight just how wide the range of outcomes can be over a one-year investment horizon.
Naturally, it makes more sense to look past the outliers and focus on the middle ground, the 25th to 75th percentile range. That is where the more typical outcomes lie, offering a clearer picture of what most investors have actually experienced over the past thirty-nine years.
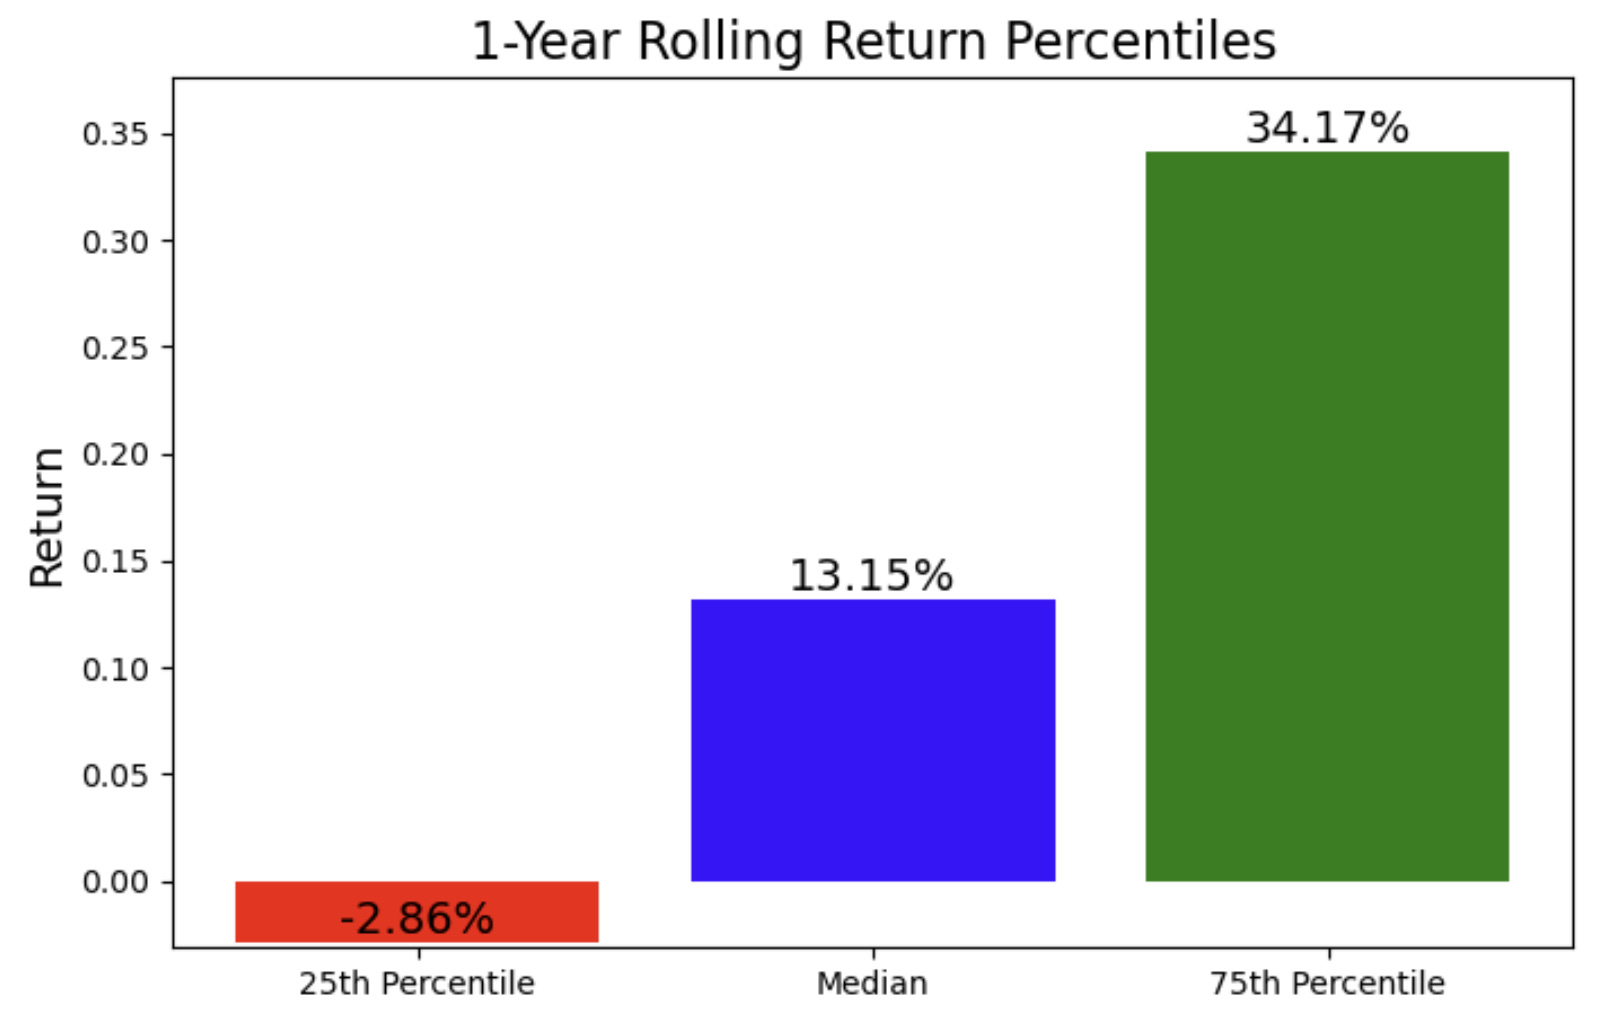
Based on the chart above, it is clear that we should not be surprised if the Sensex delivers returns of -3% or 34% in a single year. Such outcomes are well within the historical range of returns when viewed over a one-year period.
Now, what if you are investing for five years?

Again, if you were very unlucky, or very lucky, you could have lost almost 8% CAGR over five straight years, or made nearly 55% CAGR over the same period. The 25th to 75th percentile range, tells a slightly different story.
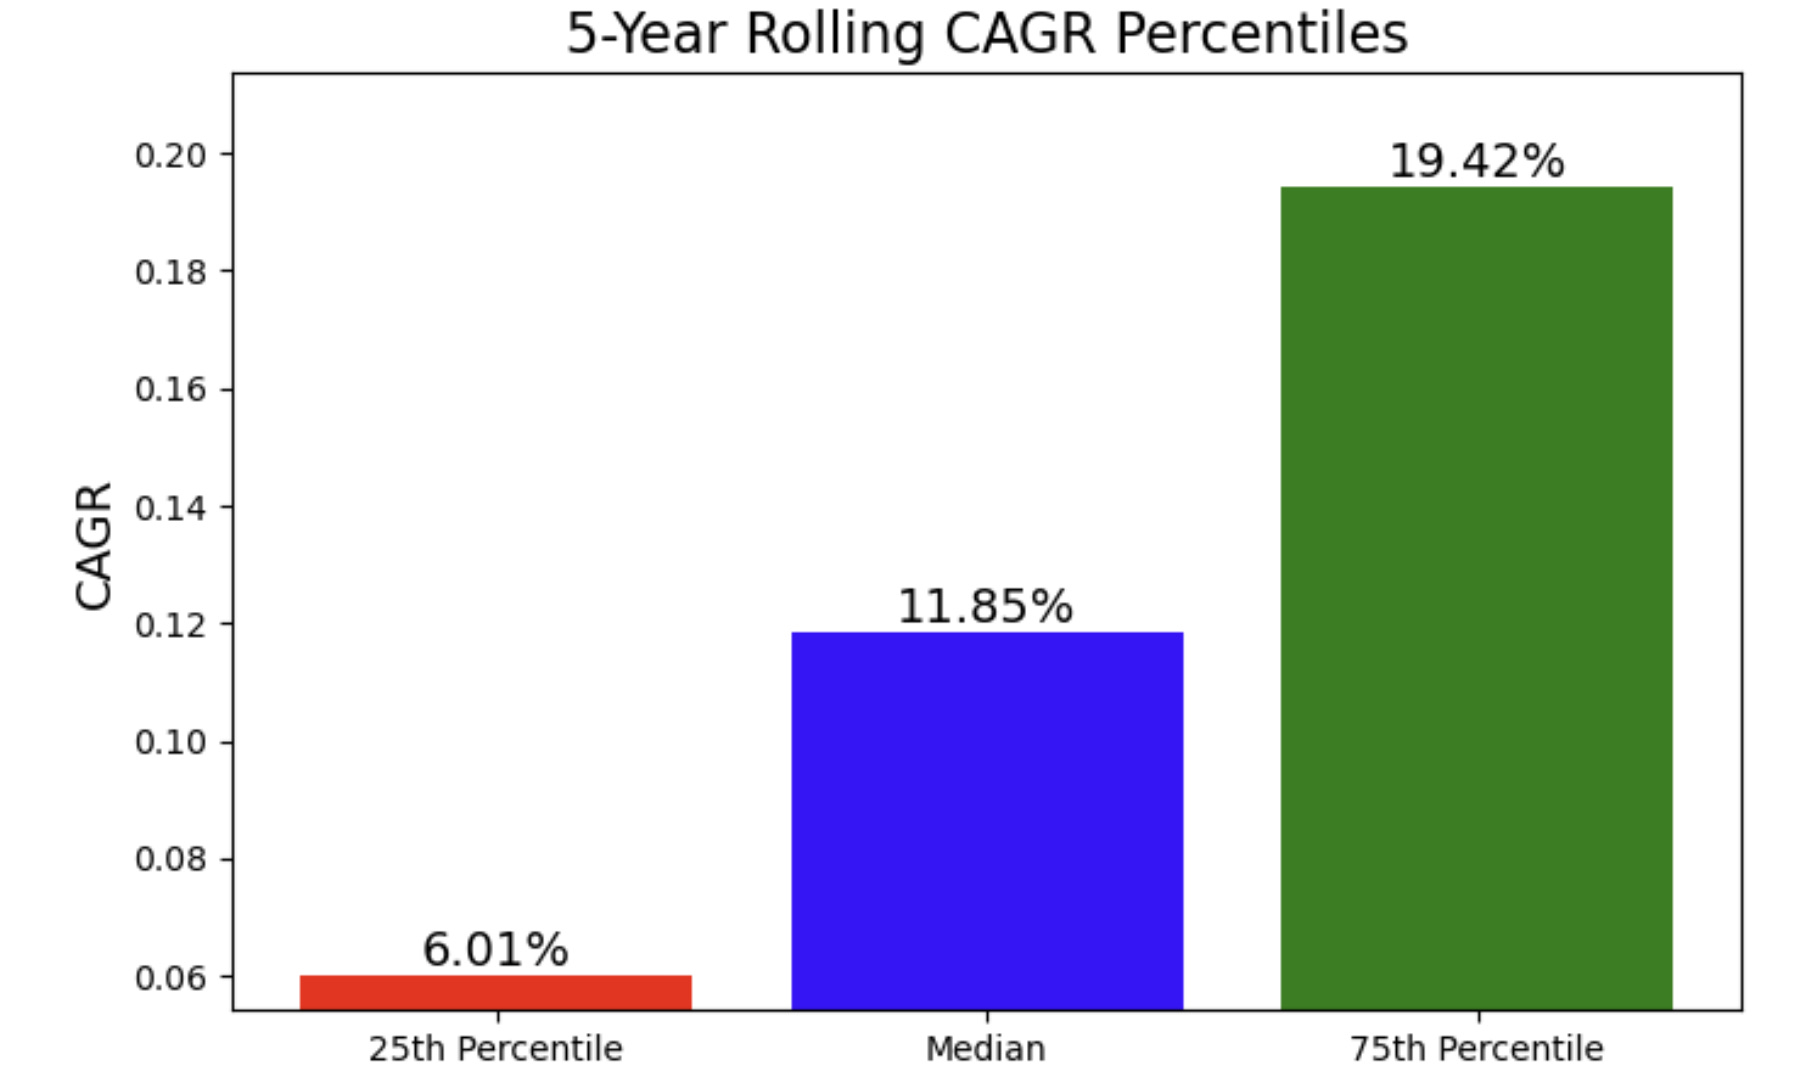
Anywhere from 6% to 19% CAGR has been well within the realm of possibilities when investing over a 5-year period in the Sensex. A narrower range than the one year rolling returns. Now, let’s look at a ten-year period.

What is scary is that you could have actually bought the Sensex sometime in 1992, forgotten about it, held on for ten years, and made no money. Now, of course, this is the worst ten-year period possible and is an outlier, but still, think about it. A ten-year outlier is a scary, scary place to be.

The percentiles show that historically anywhere between 9% to 17% for the Sensex, over a ten-year period is not unusual.
What you may have noticed is that as the investment horizon gets longer, the range of possible returns becomes narrower. In other words, the more time you stay invested, the less unpredictable your returns tend to be.

The IQR (Interquartile Range) is the gap between the 3rd quartile and the 1st quartile. It falls dramatically as we increase the time horizon of investing.

And what is remarkable is that we see this same trend in global markets too. I did the same exercise for Nasdaq, with data from 1972 to 2025.


So if you are new to investing here are two crucial takeaways from this
Investing for the long term narrows the range of outcomes. The longer you stay invested, the more predictable and stable your potential returns become. A single year can feel very chaotic. Things could go extremely well or horribly wrong. Decades normalize some of this chaos.
Of course, the future might not look like the past. Things could change completely and all this history might not matter at all. But with so much uncertainty around the markets and not much else to go on, it really helps to know the base rates.
Thanks for reading.
Disclaimer:
This content is for informational purposes only and does not constitute investment advice. While I have made every effort to ensure the accuracy of the information, errors or omissions may occur. I am not liable for any financial decisions made based on this information. Data referenced is sourced from Google Finance.
Try for Nikkei, FTSE over last 30-40 years